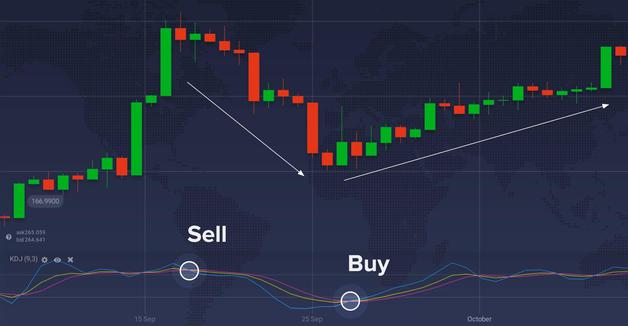
Simple calculation
Calculation of KDJ
Today’s closing price-N day lowest price
Today (N) day RSV=(—— ———————————)×100;
Highest price in N day-Lowest price in N day
Today (N) day K value = 2/3 yesterday K value + 1/3 RSV of today (N) day;
D value of today (N) day = 2/3 D value of yesterday + 1/3 K value of today (N) day;
J value for today (N) day = 3 D value for today (N) day-2 K value for today (N) day.
The initial value of K and D is 50.
The Kdi stock technical indicator is originally a stochastic indicator, which is only applicable to disconnect operations. But it can also be selected according to the characteristics of the market or commodities. However, applying KDJ to weekly or monthly charts can also be used as a medium and long-term forecast tool.

Main application
Whether it is KDJ or slow KDJ indicator, it has become one of the most important stock price trend analysis indicators.
Main basis
When the stock price rises, the closing price tends to be close to the upper end of the price range of the day; on the contrary, in a downward trend, the closing price tends to be close to the lower end of the price range of the day. The stochastic index is designed to fully consider the random amplitude of price fluctuations and the measurement of short-term fluctuations, making its short-term market measurement function more accurate and effective than moving averages, and it is more sensitive than relative strength indicators in terms of short-term overbought and oversold in the market. . In short, because the KD line is a concept of random fluctuations. Therefore, it is very accurate for grasping the market trend in the short and medium term.
Analysis cycle
Daily, week, month, minute (mainly 60 minutes), the analysis parameter of KDJ below 10 days applies to the analysis period of about 3 days (from Jincha to Dead fork is 3 days) The period of research and judgment of KDJ whose analysis parameters are less than 50 days is about 10 days. The period of research and judgment of KDJ whose analysis parameters is more than 50 days is about 20 days.
The general cycle of the trend
The daily KDJ is the short-term and medium-term maintenance for up to 15 days-1 month. It will basically rise within a month, but the increase cannot be determined.) Monthly KDJ is a long-term, and the maintenance time is generally 3 months-5 months. 4. After the ex-weight, the KDJ index has no significance for research and judgment. /p>
Application of Indicators
Generally speaking, the D line turns from downward to upward as a buy signal, and from upward to downward as a sell signal.
2, KD fluctuates in the range of 0-100, and 50 is the long-short equilibrium line. If you are in a long market, 50 is the support line for a retracement; if you are in a short market, 50 is the pressure line for a rebound.
3. The K line crosses the D line at the low position as a buy signal, and the K line crosses the D line at the high position as a sell signal.
4. K line entering above 90 is an overbought zone, below 10 is an oversold zone; D line entering above 80 is an overbought zone, and below 20 is an oversold zone. You should pay attention to the timing of buying and selling.
5. The M-shaped trend of the D line in the high-end zone is a common top pattern. When the second head appears and when the K line crosses the D line for the second time, it is a sell signal. The W-shaped trend of the D line in the low-end zone is a common bottom pattern. When the second bottom appears and when the K line crosses the D line for the second time, it is a buy signal. When the second part of the M-shape or W-shape appears, if there is a deviation from the price trend, they are called "top divergence" and "bottom divergence" respectively, and the trading signals have extremely high credibility.
6. The value of J can be greater than 100 or less than 0. The J indicator provides credible judgments on whether actions can be taken based on KD trading signals. Generally, when the J value is greater than 100 or less than 10, it is regarded as the time to take a trading action.
7. KDJ is essentially a random volatility indicator, so the value of N in the calculation formula is usually a small value, preferably from 5 to 14, which can be selected according to the characteristics of the market or commodities. However, applying KDJ to weekly or monthly charts can also be used as a medium and long-term forecast tool. Help me
